Debugging in the Age of Session Replay: Seeing What Users Saw
Created on 1 November, 2025 • Developer Tools • 347 views • 4 minutes read
Discover how session replay is transforming debugging by letting developers see exactly what users experienced. This new approach eliminates guesswork, speeds up error reproduction, and provides full technical context.
The traditional debugging process is a painful cycle of receiving a vague bug report ("The form broke"), asking the user for more details, and then spending hours trying to reproduce the issue locally. This era of guesswork is rapidly ending, thanks to a new generation of debugging tools with session replay. These powerful platforms record every user action, network request, and console log, allowing developers to literally see what the user saw right before an error occurred. This shift from error reporting to error reproduction is a game-changer for frontend development and user experience.
What is Session Replay and Why Does it Matter?
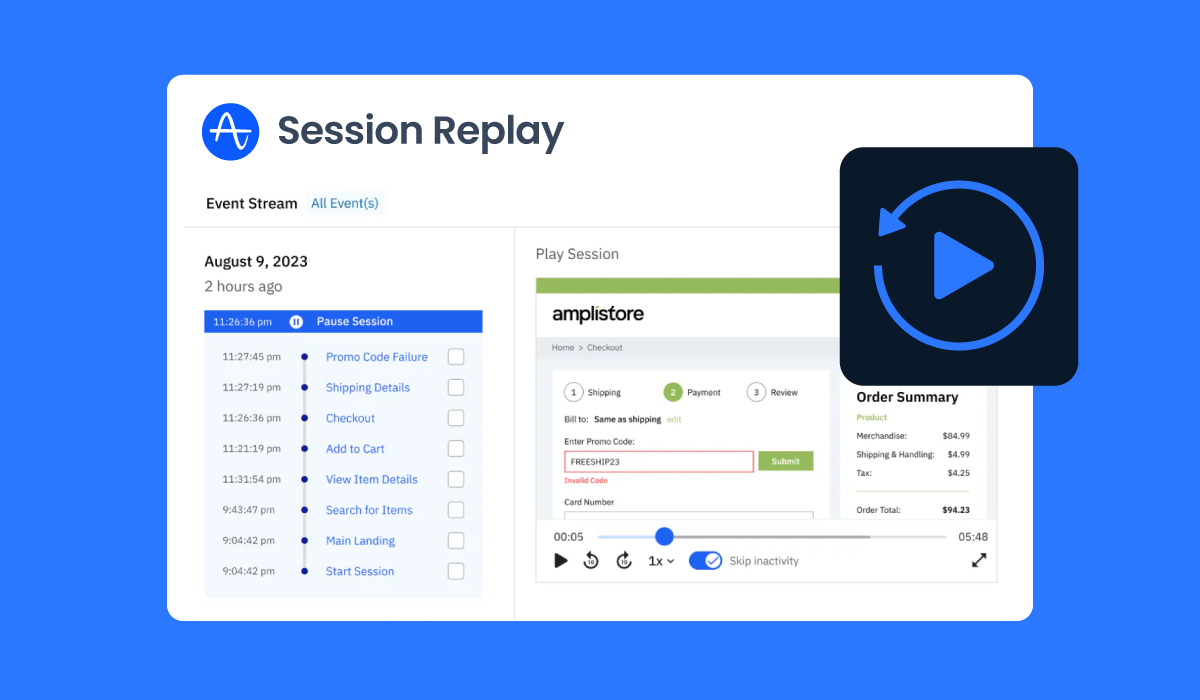
Session replay is the process of recreating a user's journey on a website or application. It's not a video recording, but a reconstruction of the DOM (Document Object Model) based on recorded user events (clicks, scrolls, key presses) and technical data (network traffic, console errors).
The Power of Context
The primary benefit of session replay is the immediate context it provides. When an error is logged, the session replay tool automatically links the error to the exact moment it happened in the user's session. This eliminates the need for:
Guesswork: No more relying on vague user descriptions.•Time-Wasting Reproduction: Developers can instantly jump to the moment of failure without manually clicking through a complex user flow.
Missing Data: The replay often includes the state of the application (e.g., Redux or Vuex state), network requests, and performance metrics, providing a complete picture of the environment.
Leading Tools in the Session Replay Space
While many tools offer some form of session recording, a few stand out for their deep integration with developer-centric debugging features.
LogRocket: The Developer-First Approach
LogRocket is often cited as the gold standard for developer-first session replay. It combines visual playback with a deep dive into the technical stack.
Technical Telemetry: LogRocket records console logs, JavaScript errors, network requests (including headers and bodies), and even application state changes (for Redux, Vuex, etc.).
Performance Monitoring: It tracks performance metrics alongside the session, allowing developers to see if a slow API call or a large asset load contributed to a user abandoning a task.
User Identification: It allows developers to link the session directly to a known user ID, making it easy to search for sessions from specific customers who have reported an issue.
Sentry Replay: Integrated Error Monitoring
Sentry Replay integrates session replay directly into the Sentry error monitoring platform. For teams already using Sentry for error tracking, this provides a seamless workflow.
Seamless Integration: When a Sentry error is triggered, the platform automatically captures the preceding session replay. This means the error report now comes with a "Watch Replay" button, instantly transporting the developer to the moment of failure.
Code-Level Context: Sentry's strength is its code-level context. The replay is directly tied to the stack trace, allowing developers to see the visual failure and the line of code that caused it simultaneously.
Sampling and Filtering: To manage data volume, Sentry allows for intelligent sampling, ensuring that sessions leading to errors are always recorded, while general traffic can be sampled to control costs.
Beyond Debugging: The UX and Product Value
While the immediate benefit is faster debugging, session replay tools offer immense value to product managers and UX designers.
Identifying Friction Points: Watching sessions reveals where users hesitate, click rage, or abandon a flow. This visual data is far more powerful than simple heatmaps or analytics.•
A/B Test Validation: You can watch sessions from users in different A/B test groups to understand why one version performed better than the other, moving beyond just the quantitative data.
A Note on Efficiency and Workflow
In the modern development workflow, efficiency is everything. Just as developers use tools to streamline their code deployment and version control, they should use tools to streamline their debugging process. Every minute saved on bug reproduction is a minute spent on feature development.Speaking of efficiency, managing and sharing links to these session replays can be cumbersome. For quick, professional sharing of long URLs—whether they point to a LogRocket session, a Sentry error, or a new feature you want a colleague to review—a reliable URL shortener is an essential utility. It ensures your links are clean, trackable, and easy to share across any platform. You can find a great, simple tool for this at https://shortus.xyz/.
Conclusion
Debugging tools with session replay are no longer a luxury; they are a necessity for any team serious about application quality and user experience. By providing a complete, visual, and technical record of the user's journey, tools like LogRocket and Sentry Replay eliminate the guesswork from bug fixing. They empower developers to move faster, deliver higher-quality code, and ultimately build better products by seeing the world exactly as their users do. The future of debugging is visual, and session replay is leading the way.